ICT Mentorship Core Content - Month 03 - Institutional Order Flow
null
Click
Use
to move to a smaller summary and to move to a larger one
Understanding Institutional Order Flow in Trading
- Institutional order flow refers to the movement of large-scale orders from institutional traders in the market.
- Analyzing institutional order flow can help traders anticipate price movements and identify areas of liquidity.
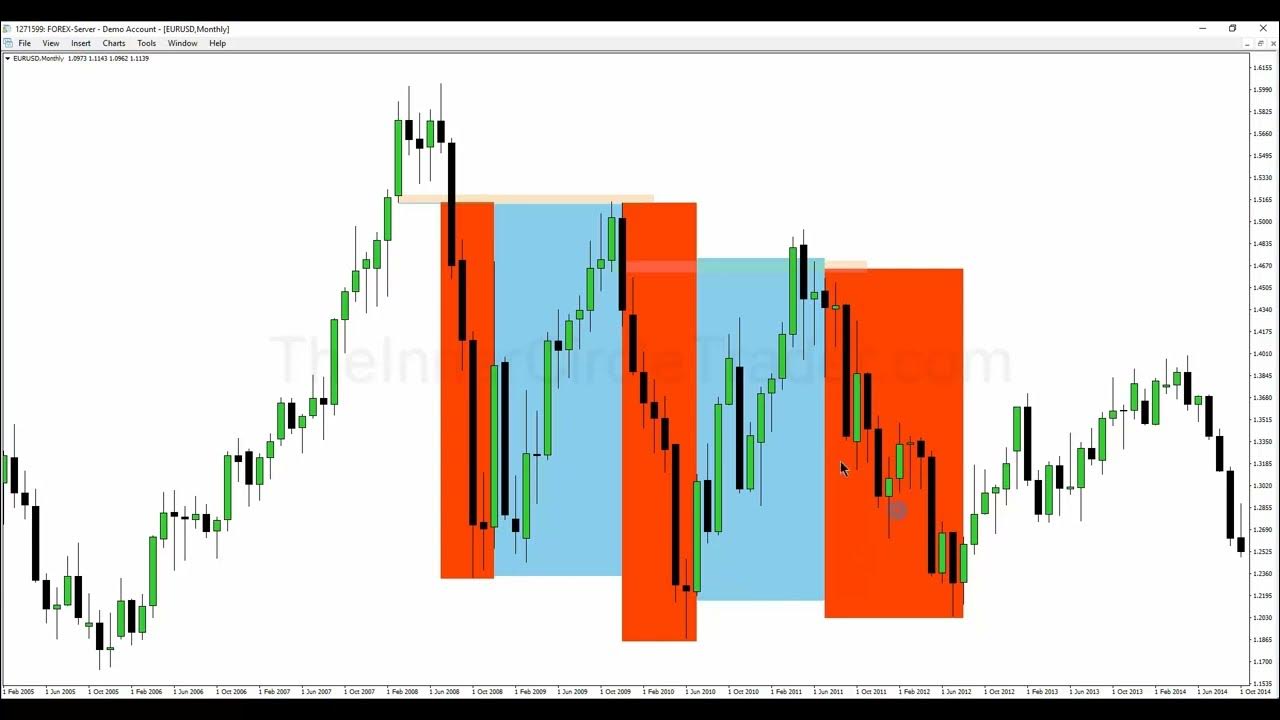
- Institutional order flow can be observed on different timeframes, such as monthly charts.
- Looking at the bodies of candles rather than the wicks can reveal areas of liquidity.
- Market efficiency paradigm involves thinking like a market maker and identifying the maximum level of liquidity relative to past and present market movements.
- Areas of liquidity can be identified by observing where the market has traded from and where it is currently located.
- When the market rebalances by closing a liquidity gap, it may seek liquidity in the opposite direction.
- The color of candles can indicate the direction of institutional order flow, with black candles representing selling pressure and green candles representing buying pressure.
- By understanding institutional order flow, traders can anticipate where the market may move next based on liquidity-seeking behavior.
Understanding Candlestick Analysis and Institutional Order Flow
- The bodies of the candlesticks hold the institutional volume, while the wicks are related to retail pricing.
- Erroneous price action can occur due to brokers allowing price to run farther than expected.
- Analyzing the bodies of the candlesticks provides a clearer view of the market and volume from an institutional order flow standpoint.
- Price tends to trade just below the bodies of the candlesticks to seek the truest form of institutional volume.
- Market movement can be predicted by identifying areas where price is likely to reach for liquidity.
- Violations of certain lows or highs can indicate potential range expansions or stop clearing.
- Bullish or bearish order blocks can influence price movement, even if there is some wicking through them.
- Wicks are not significant barriers for institutional order flow, but stops are expected to be resting below the bodies of the candlesticks.
Analysis of Price Movement and Institutional Order Flow
- The bodies of the candlesticks indicate the respect of a bullish order block, suggesting that price may trade down to that level in the future.
- If the bullish order block is recapitalized and stops are cleared, price may reach up to the next level of institutional order flow, creating a bearish order block.
- As price rallies up, institutional order flow remains bullish until it reaches the bearish order block, where stops below the lows are cleared.
- The violation of the candlestick bodies by a down candle indicates a shift in institutional order flow to the downside.
- Price may then retrace back into the previous order block before reaching up to the bearish order block.
- By understanding monthly levels of institutional order flow and points of reference, the entire price movement can be mapped out on a higher time frame chart.
- The larger funds and banks reprice based on these institutional order flow levels, which are not primarily for retail traders.
- Analyzing the candlestick bodies and wicks helps identify potential buying or selling opportunities within the order blocks.
Analysis of Price Movements and Institutional Overflow
- Bullish prices expected until reaching a monthly bearish order block.
- Price repelled and breaks down after violation of a specific candle.
- Market provides clear delivery of price with crystal clear opportunities.
- Price trades lower, followed by a small retracement and then a sell-off.
- Bearish order block is formed, leading to new selling and acceleration downward.
- Institutional overflow reaching for stops below the bearish order block.
- Pattern formed to undo the bias of previous buying.
- Price moves between range extremes, with hedging and bookmaking taking place.
- Unwinding of long positions as sellers take off the orders used to go long.
- Market reaches below consolidation, clearing out stops.
- Another layer of institutional order flow is sought for the opposite side.
- Expectation of market trading back into down candles for new buying opportunities.
Analysis of Price Movement and Trading Strategy
- Identifying candlestick patterns and their significance.
- Understanding the motivation behind selling at a specific point to drive prices lower.
- Smart money using sell stops to trigger market orders and buying opportunities.
- Mitigating short positions by buying them back and causing explosive price action.
- Expected buying and expansion after reaching a bull shoulder block.
- Objectives of price movement: reaching previous high, triggering stops, and expanding further.
- Confirmation of bearishness through breaking key candlestick levels.
- Reaching for liquidity and ultimately returning to the bull shoulder block.
- Analysis on different time frames for more detailed insights.
- Daily chart showing a bullish candle within a bearish order block and subsequent retracement.
Market Analysis and Trading Strategy
- Market is showing a pattern of bull and bear shoulder blocks.
- Daily chart indicates a drop in prices, while the institutional overflow on the monthly chart suggests a potential buying opportunity.
- Buyers enter the market when price breaks above short-term highs and comes back down to the monthly bullish order block.
- Buying opportunities occur when price hits previous down candles and rallies away.
- Consolidation periods are followed by new buying opportunities.
- Market responds to the weekly and monthly order blocks.
- Bearishness is expected when price breaks below the monthly bearish order block.
- Look for a return back to a breaker or a bearish order block when price breaks down.
- Consider the weak or bearish institutional overflow on the daily chart.
- Mitigation blocks occur when the market returns to a monthly order block, unwinding previous buying.
- Red areas on the charts indicate the creation of new bearish order blocks.
Understanding Institutional Order Flow in Trading
- The market seeks large institutional liquidity found on the monthly and weekly charts.
- The biggest moves in price are found on the monthly and weekly basis.
- Large funds control billions of dollars and their orders drive the market.
- Transpose levels from the monthly and weekly charts onto the daily chart for better trading signals.
- By trading around these levels, traders can anticipate significant price swings before they happen.
- Understanding institutional overflow helps identify where stops or liquidity are located in the market.
- The market goes to these levels to either remove participants or draw them in as counterparties.
- Trading based on institutional order flow increases the chances of successful trades.
Key Points for Successful Trading
Analyzing Institutional Order Flow in Market Trading
- Institutional order flow refers to the movement of large-scale orders from institutional traders in the market.
- Analyzing institutional order flow helps traders anticipate price movements and identify areas of liquidity.
- The bodies of candles, rather than the wicks, can reveal areas of liquidity.
- Market efficiency paradigm involves thinking like a market maker and identifying the maximum level of liquidity relative to past and present market movements.
- The color of candles can indicate the direction of institutional order flow, with black candles representing selling pressure and green candles representing buying pressure.
- Analyzing the bodies of the candlesticks provides a clearer view of the market and volume from an institutional order flow standpoint.
- Price tends to trade just below the bodies of the candlesticks to seek the truest form of institutional volume.
- Violations of certain lows or highs can indicate potential range expansions or stop clearing.
- Bullish or bearish order blocks can influence price movement.
- The bodies of the candlesticks indicate the respect of a bullish or bearish order block.
- Understanding monthly levels of institutional order flow and points of reference helps map out price movement on a higher time frame chart.
- Analyzing the candlestick bodies and wicks helps identify potential buying or selling opportunities within the order blocks.
- Smart money uses sell stops to trigger market orders and create buying opportunities.
- Market movement objectives include reaching previous highs, triggering stops, and expanding further.
- Confirmation of bearishness can be achieved through breaking key candlestick levels.
Understanding Market Patterns and Institutional Order Flow for Successful Trading
- Market shows patterns of bull and bear shoulder blocks.
- Daily chart indicates a drop in prices, while monthly chart suggests a potential buying opportunity.
- Buyers enter when price breaks above short-term highs and comes back down to the monthly bullish order block.
- Buying opportunities occur when price hits previous down candles and rallies away.
- Consolidation periods are followed by new buying opportunities.
- Market responds to weekly and monthly order blocks.